The workflow for working with urban planning schemes in the Tygron Platform has been significantly improved recently. As a result, design and planning processes align better with how municipalities, urban planners, and design teams work in practice. During this in-depth session, you will discover how to set up, analyze, and assess a digital urban planning scheme against policy objectives and design criteria faster and better, supported by new functions for data processing, modeling, and scenario comparison.
- Location: Barchman Wuytierslaan 10, directly opposite the Central Station in Amersfoort.
- Time: May 12 from 9:30 – 12:00
- Participation: Free
- Number of participants: Maximum 16 (so please register in time)
- Followed by lunch
- If you have specific topics you would like to cover in this in-depth session, please enter them in the form below, and we will ensure we take them into account as much as possible.
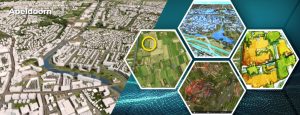
Context and vision
At Tygron, we understand that sustainable urban development is not just about design, but above all about making well-founded choices. Municipalities and design teams constantly weigh policy objectives, spatial quality, and feasibility against each other, while plans change more rapidly and complexity increases. This calls for a working method in which data, design, and assessment come together seamlessly and reinforce each other. The Tygron Platform supports this by bringing together the entire urban planning process – from brief to analysis and communication – into one coherent workflow. With the Tygron Platform, we aim to ensure that various roles – from urban planner and program manager to designer and advisor – can each get to work on this in a workable manner, based on their own expertise and responsibility, using the same foundation.
Program
During this session, we will go through the entire urban planning process step-by-step: from the initial impetus and KPI definition to importing, testing, and presenting a design. We will do this first in a classroom setting, but afterwards you will work hands-on in the platform, learning to use the latest features for IFC and AutoCAD import, QGIS WFST manipulations, optimized scenario calculations, and indicator comparison.
The session consists of five logical steps:
- From challenge to criteria
You start from a spatial challenge — such as housing development, greening, or climate adaptation — and determine which design criteria and policy objectives apply. This forms the basis for the KPIs you will use to manage your decisions later. - Setting up a basic digital twin
You create a model of the current situation, link relevant map layers, and determine which indicators and data types are needed to assess the quality of future designs. - Importing and preparing designs
You learn how to import urban design via IFC, AutoCAD, or WFSTQGIS and which data is essential for a usable digital design. - Testing and comparing scenarios
Next, you test different variants based on those KPIs, indicators, and model outcomes. You use, among other things, scenario calculation, the difference overlay for insight into improvements, and some tips to make these faster, such as with the limit map functionality. - Communicating Results
Finally, you will learn how to prepare and design digital results so that even a less technical audience can easily understand the insights. You will work with dashboards, viewers, screenshots, and indicator visualizations to share information clearly.
Because the entire process covers a lot in a single session, we will go through the whole step-by-step plan in a classroom setting: from assignment and basic model to design, testing, and communication.
Afterwards, there is room for in-depth exploration. During the session, you choose one of three core topics to work on with us:
- Setting up a strong basic model and KPI structure
How do you translate a spatial assignment into a well-substantiated model with clear KPIs and indicators that truly guide design choices? - Properly loading an urban design
What requirements must a design meet to be properly testable? We will delve deeper into loading and structuring designs via IFC, AutoCAD, and WFST-QGIS. - From data to understandable information
How do you prepare model results so that even less technically savvy end-users and stakeholders can understand and use the insights? Think of dashboards, viewers, and visualizations.
If you already have a specific preference you would like to work on, please enter it in the form below, and we will ensure we take it into account as best as possible.