Two weeks ago heavy rainfall resulted in floodings in south/east of the Netherlands. Although the main river Maas did have some issues, most unexpected floodings where caused along secondary rivers like the Geul and the Roer. During that time the Tygron team tried to model the valley of the Geul in the southern part of Limburg to provide help if needed and also to learn.
This week we improved the model with the actual measured rainfall over time so we can recreate the event. There is also a lot of information about the event (measurements, satellite imagery and of course Twitter) that allows us to do a proper validation of the result. This process improves the software and makes us better prepared for future events.
Setup
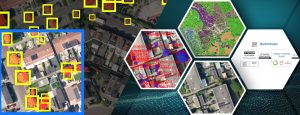
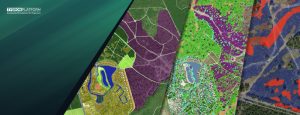
We started by generating a map of the complete Geul catchment area. The Geul is almost 60 kilometers in length with many more side streams. It starts in Belgium just below Aachen and has several smaller side rivers. The map generation is an automated process which uses public data sources to create a detailed project containing millions of GEO features:
- Heightmap: AHN in the Netherlands, in Belgium the world elevation map from ESRI is used.
- Buildings & Infrastructure: BGT, BAG, CBS, Top10NL, NBW in the Netherlands and OpenStreetMaps in Belgium.
- Terrain: Rivers, crop fields, woodlands etc. from BGT, BRO, Top10NL , BRP in the Netherlands and again OpenStreetMap data for Belgium.
- Hydraulic structures: e.g. culverts from the Waterschapshuis Information model.
Variables like ground infiltration speed or manning roughness values are determined based on geo information. For example a grid cell with cobblestone road (BGT, NBW) on sand (BRO) and some corn fields (BRP) on the side has a unique value.
We decided to simulate three days, of which the first two days contained the heaviest showers.
- Rainfall is measured daily at several KNMI weather stations in Limburg. These were remapped to 100 tiles containing the rainfall sum of each day using a script.
- Evaporation was very low (less then 1 mm), the daily Makkink value was retrieved from the KNMI station in Maastricht.
- Groundwater. Although groundwater flow (included in the simulation) is minimal, having some information about the storage capacity of the underground is important. To gain some insight we used the historic data available at Waterstandlimburg.
Validation
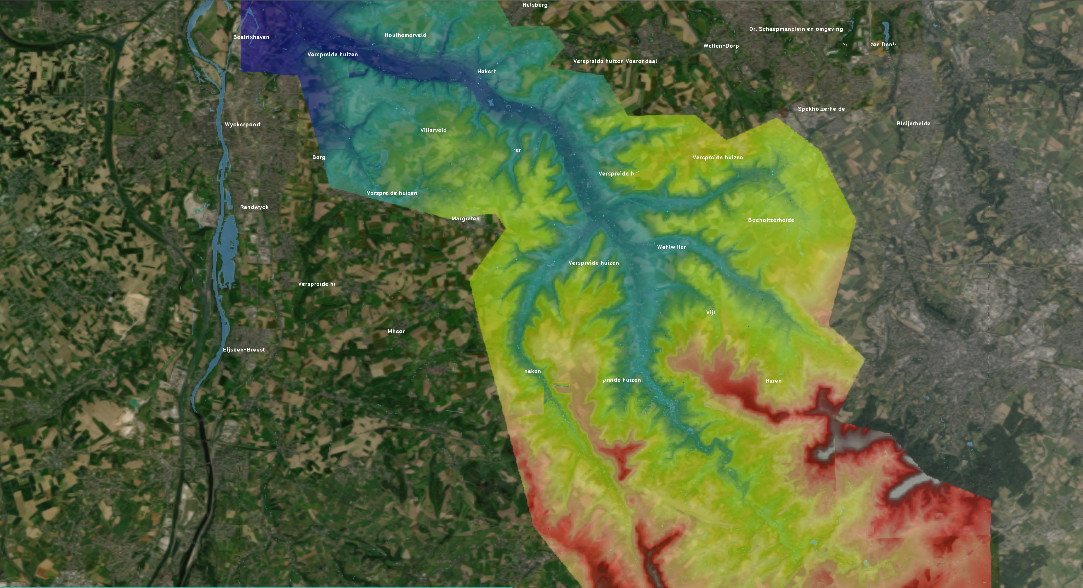
After the setup process was completed we compared the simulated results with several sources.
- Flooding maps from satellite imagery. These can be very useful to check if the water was outside the river bedding. We used data from the Sentinel satellite provided via Deltares & Earth Engine.
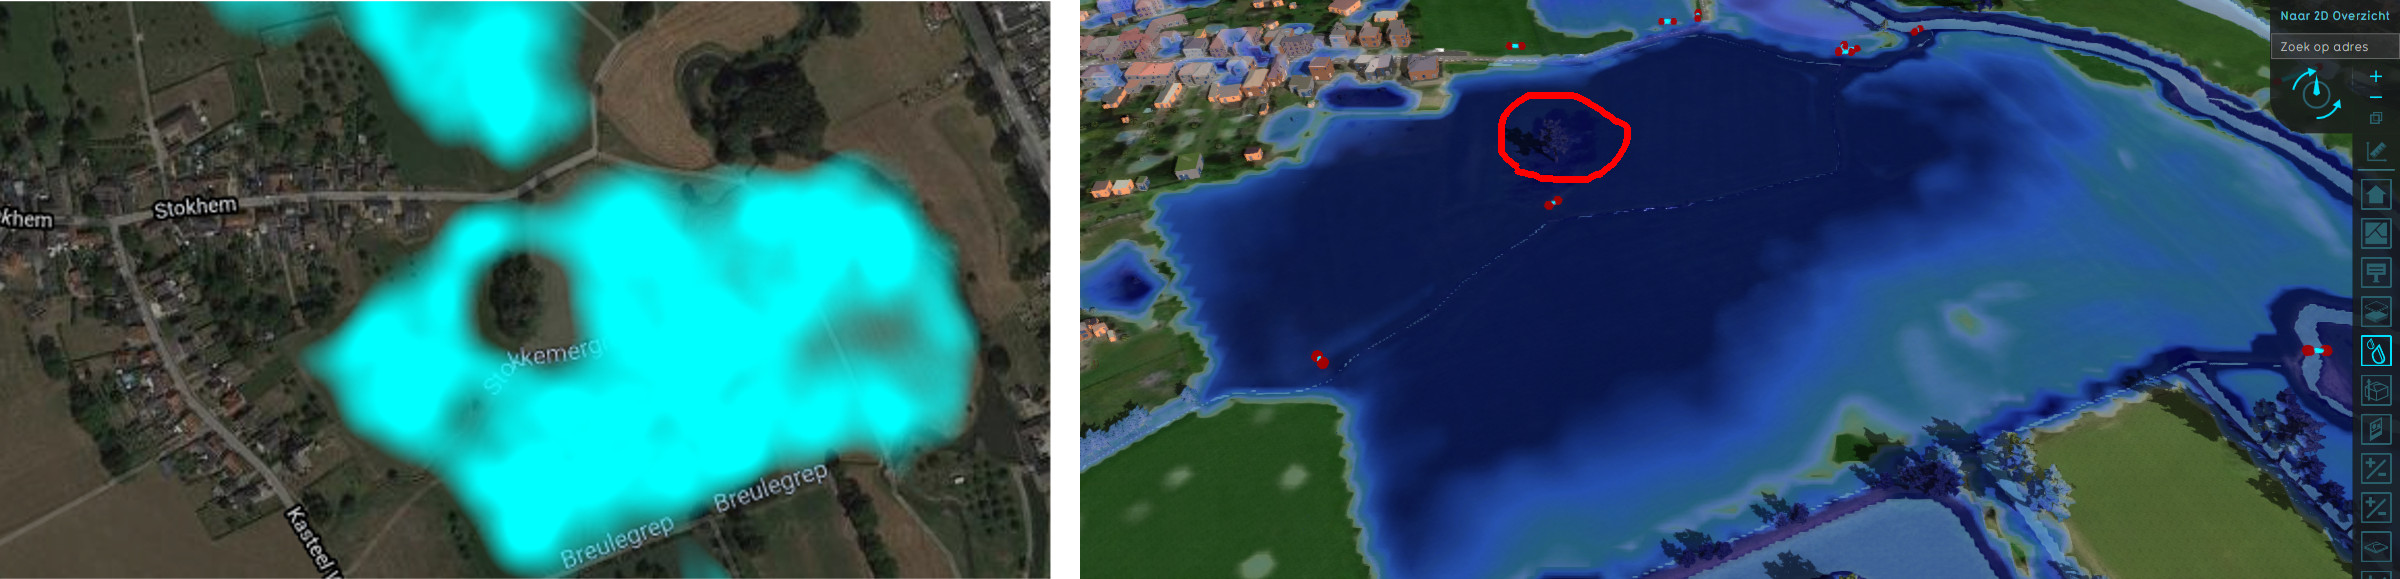
- We did however also find several places that were flooded according to the simulation but did not show up in the satellite imagery. This might be explained woodlands that distort the imagery or because the flooding is very short and the satellite was not in orbit at that moment? We investigated a few of the locations. For example restaurant The Geulhof near Meerssen did not show up on satellite imagery, but was actually flooded according to local newspaper 1Limburg.

- Water level (m) measurements from Waterstandlimburg. This website provides excellent water level measurements at 20+ point along the Geul and side streams.
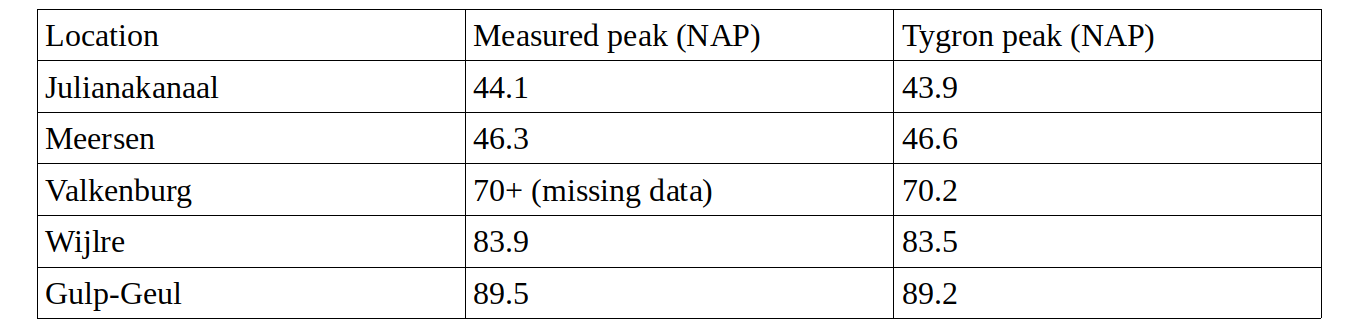
These calculated values are all within a margin of +/-30cm from the measured data in the main Geul valley. Note that in many places like Valkenburg, the Geul reached more then 300cm above the regular level.
We did see some bigger NAP differences near the Belgium border but this is related to how the river bedding is setup, looking at the relative level increase (max level – bedding) Slenaken and Cottessen are also within 30cm margin.
- Finally maybe the best validation is done on the measured flow (m3/sec) at the exit point of the Geul near Meerssen.
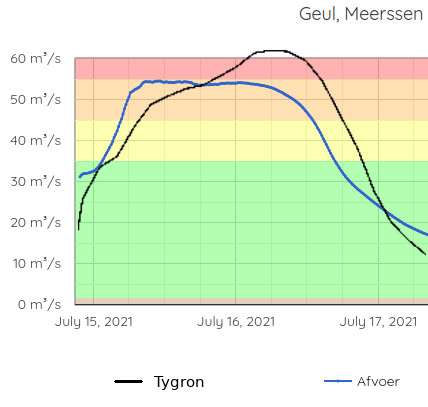 Comparing the flow over time you see the same trend line, Tygron starts lower on the first day and compensates on the second. I have tested a few variables and I think the most likely explanation is inaccurate rainfall data. But overall the total sum of water (area below graphs) that flows trough the Geul is within a ~10% margin of what was measured.
Improvements
An important reason to model this event was to learn from it so we can do better next time. The biggest challenges we encountered were all related to data quality, which is especially important when using a high detail model in short time periods. We where able to resolve some of these issues and other still require manual checking and maybe better data in the future.
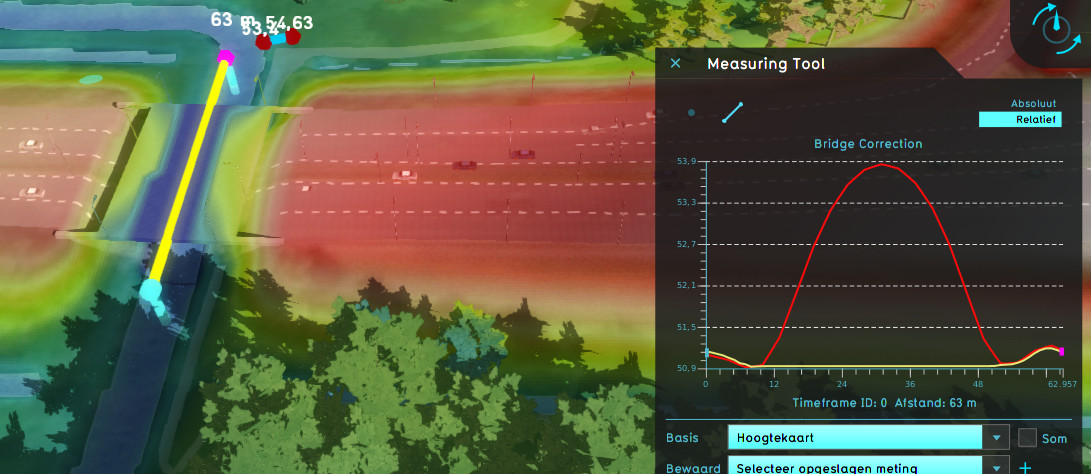
- Bridges are loaded from the BGT data as buildings and the water model uses terrain height below the bridge so the water can flow under it. However we encountered several places where the terrain elevation (not surface) has a bump below bridges, thus jamming the water flow. To resolve this we added a new advanced option that lowers the height map of the river below bridges to the lowest point under or near the entrance of the bridge. In most cases this provides a very stable flow under bridges and if needed users can still upload more detailed river bedding heightmaps.
Thousands of hydraulic structures are loaded automatically and as far as we could see there were non missing. However many did not have all the required attributes, for example the width/height of culverts is not always present. Tygron uses a fallback value, which is fine for smaller culverts, but not for bigger culverts below the the highway and Juliana canal, these needed manual fixing.
The Tygron platform currently uses an data-set from the Waterschapshuis Information-model which is more complete for the Limburg region than what is provided HyDAMO → PDOK at the moment. Water authorities are very busy at improving the data quality, so maybe over time this will resolve itself.
Finally the rainfall is now based on a daily sum from the different KNMI weather station, roughly interpolated between them. But the heavy showers can be very local, thus combining it with radar data might further improve the result. Tygron supports localized temporal showers and these can be imported using custom scripts, but maybe an automated API connection, that can be used as early warning system would be better!
Final Remarks
We were able to gather large amounts of public data, calculate the entire 60km long river catchment area at very high detail using our GPU Supercomputer and ending up with results fairly close to the measured data. Also changing some variables (e.g. culvert width or groundwater depth/flow) did not significantly change the end result.
Finally I would still recommend to have local knowledge and expertise about the watersystem. This in combination with better data sources can certainly further improve the results.