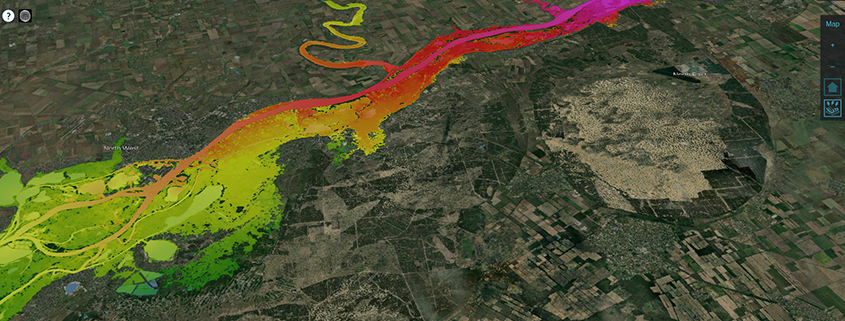
In the hours and days after the catastrophic Kakhovka dam break in Ukraine, Tygron worked intensively with Arcadis to build a model in order to gain better insights into the disaster. The resulting model, built on Tygron’s advanced [LR1] modelling technology, allowed experts on the ground to anticipate the course of the flooding and take proactive measures to mitigate its impact. Using the hydrodynamic model, the arrival times, flow velocities and intensities of the floodwater could be accurately simulated for specific areas. These insights supported the formulation of effective evacuation plans and contributed to the relief operations.
To see the results, check out map-viewer.
The timeline of Tygron’s actions following the Kakhovka dam breach:
June 6 2023: The Kakhovka dam failed at 03:00 (NL time/GMT+1) on 6 June (source: Wikipedia). The first results became available within just a few hours. We were able to validate those immediately based on images from mainstream and social media.
June 8 2023:
We received input from a former Cherson resident, an environmental engineer, who shared observations directly from the disaster area. Our first results turned out to be an underestimation of the flood; the breach in the dam had quickly become a lot larger than the one visible in the first TV images. Based on this input, we were able to continuously validate and run the model with new insights.
The existing model showed the results up to two days after the breach. We started running a second model with a 20-day time frame, i.e. predicting the effects 18 days into the future. This would give relevant insights to help determine longer-term measures.
With the help of Mykola, we calibrated the model based on geolocations of the border of the flooding (see images).
One major adjustment was to increase the size of the breach and thus the discharge (now nearly twice as large) in the model to reflect the realistic breach growth over time (from approx. 200m wide to 550m wide, based on analysis of aerial photos).
We also increased the ‘smoothness’ of the flood area (by increasing the Manning value) as there is a lot of debris that significantly impacts flow speed and surface resistance.
The 20-day model should provide additional insights into the risk of drying, and it also includes infiltration.
Other insights:
Based on the initial results from the model, drying starts approximately after seven days, although this varies based on the location.
Videos had spread of the dam upstream of the Khakovka dam still discharging water through its sluice gates. These images led people to conclude that the Khakovka dam was unnecessarily exposed to higher discharge, resulting in further destruction of the dam. However, this was not significant according to the results from the model. The simulated breach discharge was max. 25,000m3/s, which was negligible in comparison to the normal Dnieper discharge of 1,600m3/s.
June 9 2023:
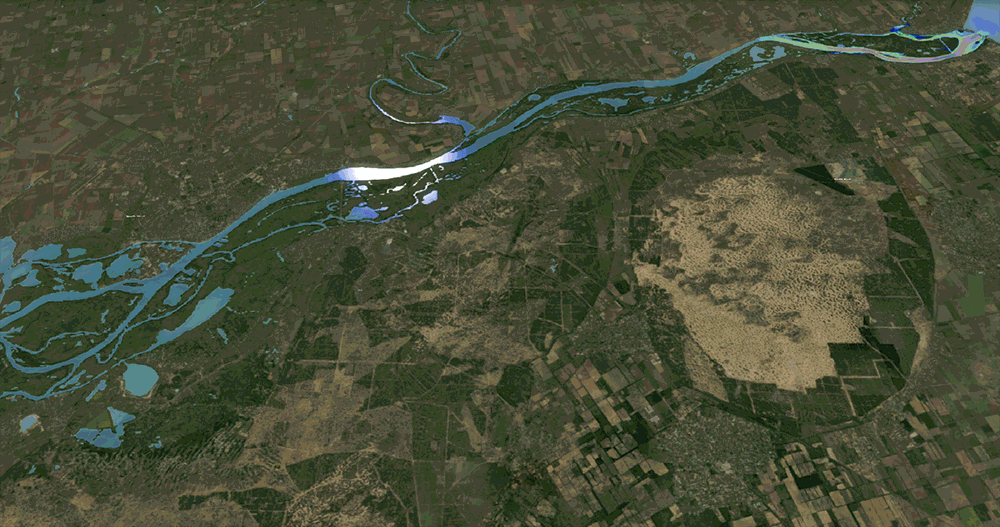
The model was updated with a 20-day predictive time frame, providing very highly detailed information about the situation in the affected areas over the coming days. While the flood peak had subsided, the area would remain flooded, although the water levels would gradually recede. The simulation provided insights into water depths over time.
Post | Feed | LinkedIn
Improvements:
smoother breach growth from 200m to 550m wide.
minor improvements to the legend
improved infiltration in the 20-day run, based on land type, with 50cm storage in the soil for the three-week period. On average, the drying starts after six to seven days.
June 11 2023:
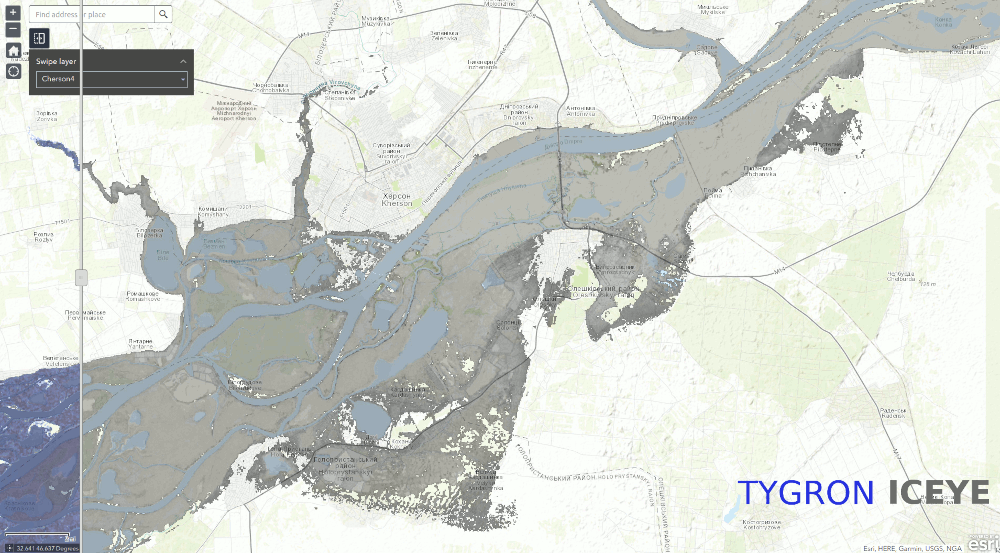
The next steps were to gradually work towards more insights and validating the approach and model. More validation material was processed, such as satellite imagery and photos of specific locations. The results were made available in a swipe viewer:
https://tygron.maps.arcgis.com/apps/webappviewer/index.html?id=4d454f03a32243b8bd3e6c9093c6fc99
A tool for crisis management agencies
We understand that collaborative efforts from different sources are vital during times of crisis, and we believe our models can significantly contribute to understanding the situation for future analysis. Tygron’s modelling capabilities can be a tool for crisis management agencies, enabling them to explore various strategies and scenarios. This includes implementing preventive measures and devising evacuation plans. Additionally, the models can provide accurate estimates of potential flood damage.
As described above, the model results are based on publicly available data and information, and are validated using news, articles and information directly from the disaster area. However, any modelling study involves a certain degree of uncertainty. If you intend to use the results for crisis management in a disaster-stricken area, or if the deployment of our modelling capabilities can assist you in any other way, please don’t hesitate to contact us.
Read more (in Dutch):