Last year Tygron breached the 1 billion grid cells threshold. Today we are using this Massively parallel GPU technology (100.000 execution tasks in parallel) for more use-cases and refining it as we go along.
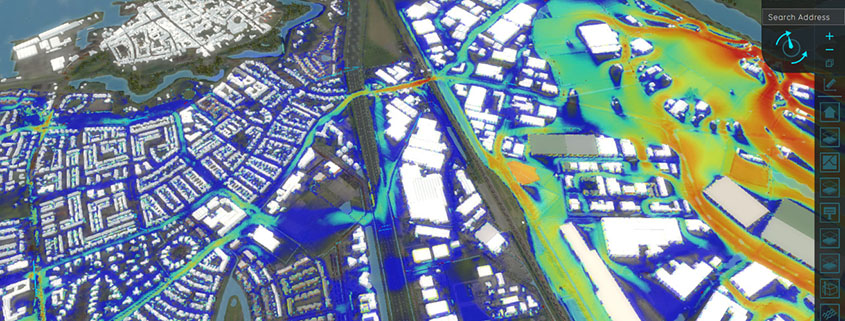
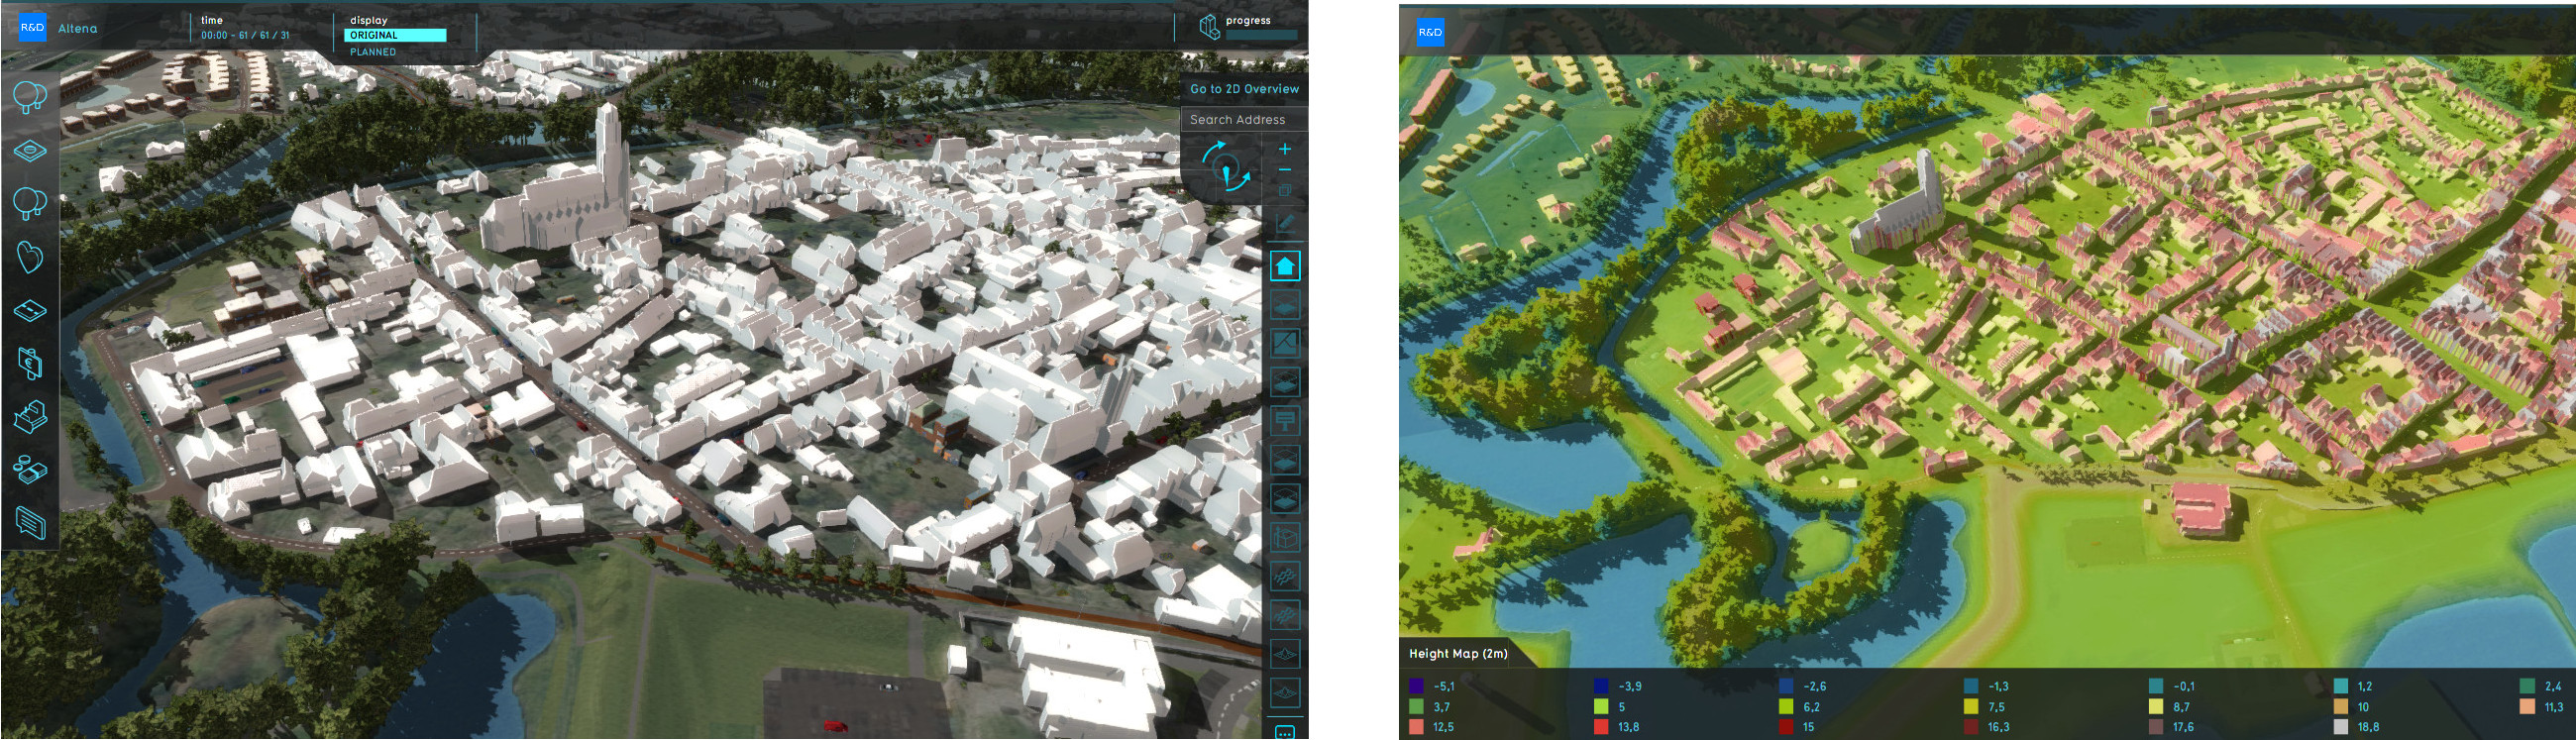
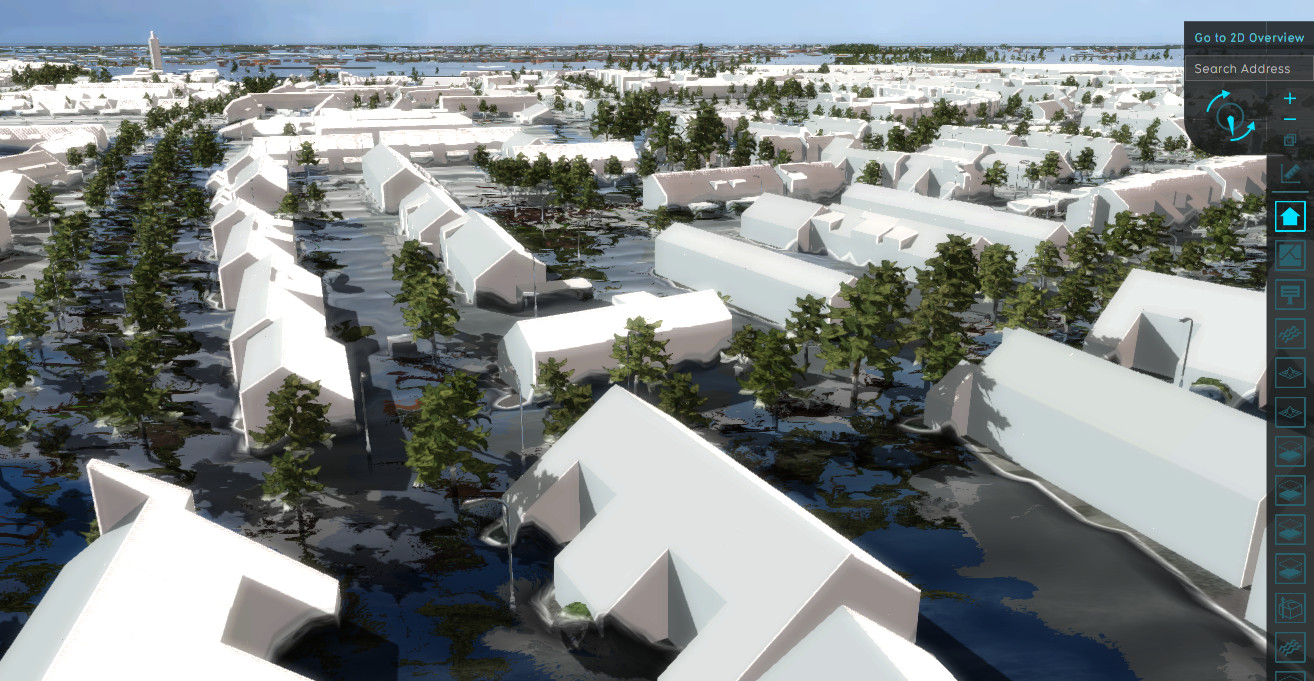
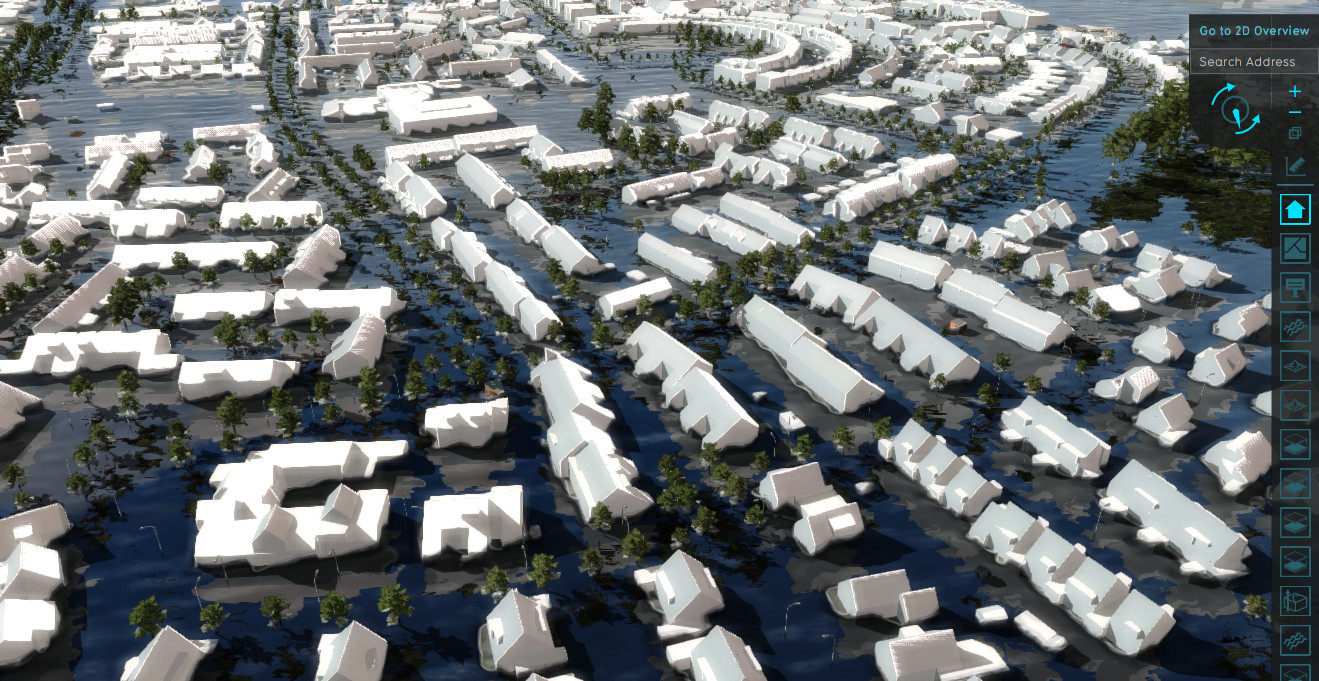
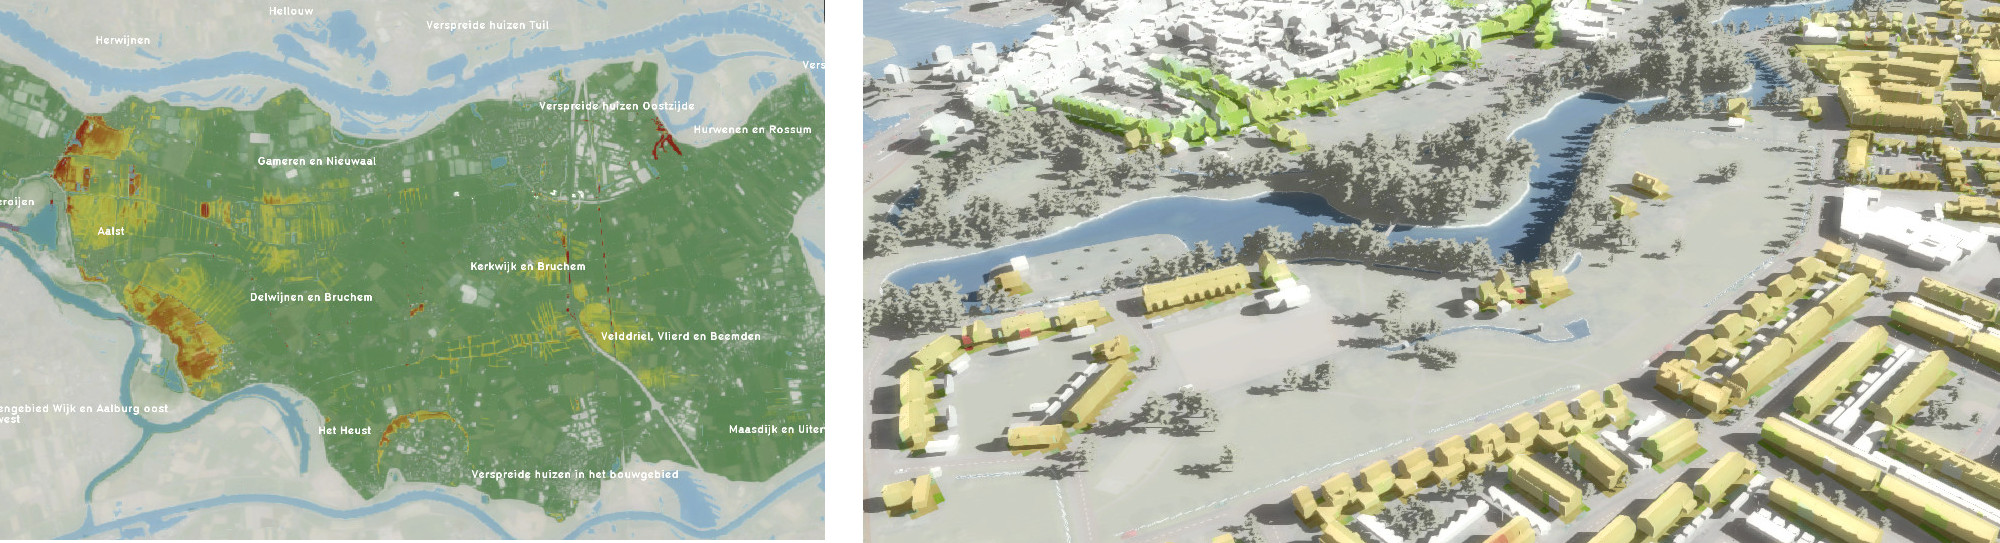
Our latest experiment was to do a hyper resolution (<=1x1m grid) flooding simulation of the Bommelerwaard, a river island surrounded by levees, situated in the Netherlands. We started by selecting the area and the software automatically loaded in several the public open data sources (BAG, AHN, BGT, BRP, CBS, etc). Then we only added a breach location triggering the flooding below.
This month we have also added support for CityJSON (and CityGML). So this experiment also proved to be an ideal case to test the latest 3D Geo Data made available by the Delft University geoinformation group.
Thus in order to further refine the experiment, we incorporated the following features into the Tygron Platform:
- CityJSON: The Tygron Platform already supports uploading your own data using the I3S format from Esri. However, we also wanted to support CityJSON, the successor of CityGML. It is widely used and supported by many applications and proves to be a very nice format with strict definitions for all building components. In the future we consider taking advantage of these components and additional meta data (e.g. addresses) provided in the format. Since it is a Geo format we did have to add triangulation (Delaunay) of the surfaces to visualize the data. We support import and export is planned in the near future. The detailed CityJSON data is also used in the surface model of the flooding simulation.
- Modular Compilation: Over the years the water module has massively grown for different use-cases like floodings, year round groundwater or urban rainfall, with 37 different result overlays available. From the start we decided to create a single system that can calculate all these components and also support the combination of these elements (e.g. flood combined with rainfall and evaporation). However, most use-cases only use a fraction of what is possible, therefor we added a modular compilation system that allows the CUDA compiler to create specifically optimized PTX instructions for different combinations. This results in more compilation variants but the execution time for end-users was reduced on average by 20%.
- Data Flow: Not only execution time is relevant, but also the amount of data (many GB’s) that flows inside the platform between the CPU based project servers and GPU clusters needed to be reduced. To accomplish this we improved this flow by adding new components like a Null-pointer implementation that is recognized in both Java and our C++ code bases. We also changed the way a GPU cluster is selected, no longer on the amount of grid cells but on an estimate of the required bytes. For example, a big 4 billion grid cells calculation with only a few variables per cell can now also be executed on a smaller GPU cluster, thus adding more capacity to the platform.
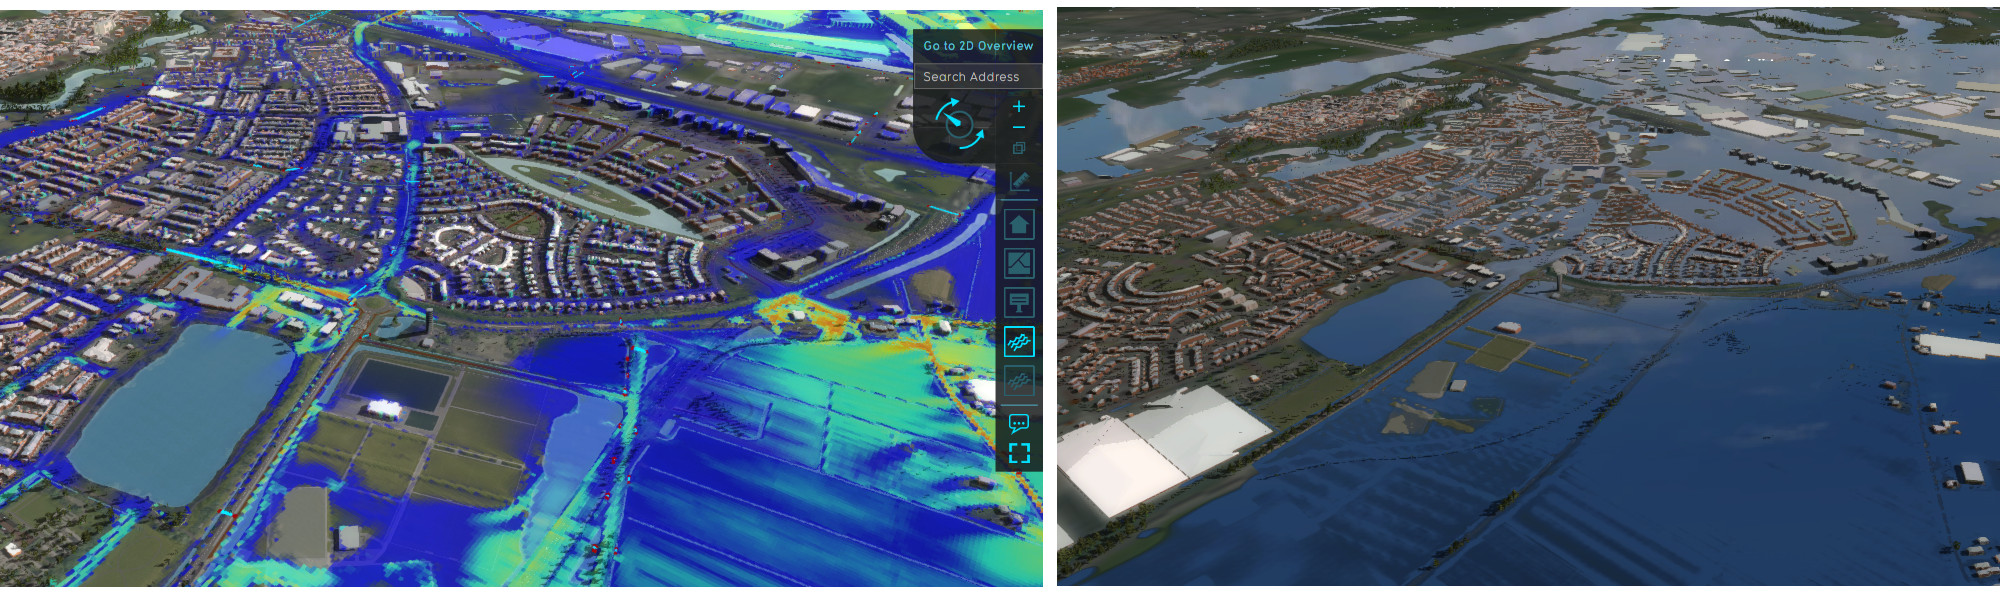
- Combo Language: Earlier this year we introduced the Combo Overlay as a BETA that allows user to create their own formula-based calculation to grid data. From the start this was a big success and we saw many different applications. For the Bommelerwaard we used the combo to calculate the “Mortality function” as described in the SSM2017 definition. This allowed us to also add some new functionalities like the error function (ERF), IF statements and improved handling of NO_DATA cells. The Combo calculation core was also parallelized, reducing the calculation time from minutes to just a few seconds.
- Hydraulic Object verification: When calculating an area the size of the Bommelerwaard, thousands of hydraulic structures, such as culverts, are automatically loaded into the project using the IMWA database. This improves the water flow in the water system, but only if the objects are placed correctly in relation to the waterways. For example, a culvert should exit in the middle of the adjacent waterway and not somewhere in the shoreline or below the surface. To correct this we have added ~100 checks to verify the correctness of hydraulic structures and provide direct feedback to the end-user. In most cases we will even provide a suggested fix for all objects at once. For example a weir that has a different height (or missing value) then the upstream water area (dutch: “peilgebied”) can be adjusted automatically based on this information.
- New Components:
- Two new water overlay results have been added; one that stores the flood arrival time and one that stores the water rise speed. These are needed to calculate the mortality of the flooding but can also be used to determine new and evaluate existing evacuation options.
- A new attribute that stores the datum level at entry/exit point of every hydraulic structure. These can then be easily exported using the API / Geo software and are also visualized in the 3D world.
- A Water area visualization (internally called the “spider”) that can provide additional inside in how the water flows in a complex water system.
Using these new features we were able to properly calculate the flooding of the Bommelerwaard at 1x1m resolution and calculate the amount of fatalities using the SSM2017 method inside the Tygron Platform. We ended up with almost identical results compared to earlier studies done by the Delft University. Which is to be expected for a flat rural area, we also did some experiments in urban areas and there you need small cells for the water to flow around the buildings, trees and infrastructure.
Finally the way SSM2017 calculates the mortality can be significantly improved (e.g. by using the arrival time and defining safe areas), which is already available in the Tygron Platform. I would love to do some additional research into this together with other researchers and end-users to come up with a better method that can be easily calculated. Maybe in the next blog entry I can share some of these findings and more details about the flooding simulation itself!